Top three stocks to buy today—recommended by Ankush Bajaj for 2 July

Top 3 Stocks Recommended by Ankush Bajaj
Buy: Punjab National Bank (PNB) — Current Price: ₹113.00
Why it’s recommended:Punjab National Bank is showing a bullish setup supported by strong momentum and a confirmed breakout. On the daily chart theRSI is trading at 70, indicating robust upward strength. On thelower timeframe, the stock has broken out of arectangle consolidation pattern at ₹113, a technical development that suggests the start of a potential continuation move toward higher levels. This breakout, combined with strengthening momentum, increases the probability of a sharp upmove toward ₹118– ₹120.
Key metrics
Breakout zone: ₹113 (validated on lower timeframe)
Support (stop loss): ₹109
Pattern: Rectangle breakout on intraday chart
RSI: 70 on the daily chart — reflects strong bullish momentum
Technical analysis:Price has resolved higher out of a rectangular consolidation zone on the intraday chart, confirming bullish intent. Momentum indicators are strengthening, and the RSI at 70 signals sustained buying interest. The stock is trading above key short-term moving averages, supporting a continued upmove. The breakout at ₹113 acts as a validation point for this bullish setup.
Risk factors:A close below ₹109 would invalidate the breakout structure and suggest a pause in momentum. Temporary consolidation may occur if the broader market experiences profit-booking or pullbacks.
Buy at: ₹113.00
Target price: ₹118– ₹120
Stop loss: ₹109
Buy: Piramal Enterprises Ltd. (PEL) — Current Price: ₹1,168.00
Why it’s recommended:Piramal Enterprises is exhibiting a bullish technical setup with improving momentum and a confirmed pattern breakout. On thedaily chart, theRSI is at 60, reflecting healthy strength with room for further upside. On thelower timeframe the stock has broken out of afalling wedge pattern, a bullish reversal formation, suggesting a shift from correction to upward continuation. The breakout points to a potential move toward the ₹1,220+ zone, with short-term targets placed at ₹1,230.
Key metrics
Breakout zone: Falling wedge breakout confirmed on lower timeframe
Support (stop loss): ₹1,137
Pattern: Falling wedge breakout on intraday chart
RSI: 60 on the daily chart — indicates rising bullish momentum
Technical analysis:The stock has resolved above the falling wedge pattern on the intraday chart, confirming a reversal from short-term consolidation to upward momentum. The RSI is steadily rising, and the price is trading above key short-term moving averages, aligning with bullish continuation. A close above the wedge resistance has unlocked potential for a move toward ₹1,230 and beyond.
Risk factors:A breakdown below ₹1,137 would invalidate the bullish wedge breakout and could signal further consolidation. Minor volatility may occur in line with market fluctuations, but the structure remains positive above the stop loss.
Buy at: ₹1,168.00
Target price: ₹1,230
Stop loss: ₹1,137
Buy: Nippon Life India Asset Management Ltd. (NAM-India) — Current Price: ₹808.40
Why it’s recommended:NAM-India is showing a bullish setup, supported by strong momentum and a breakout confirmation. On thedaily chart, theRSI is at 64, indicating healthy bullish momentum with room for further upside. On thelower timeframe, the stock has broken out of atriangle pattern, suggesting a shift from consolidation to a trending move. The breakout strengthens the case for an upward continuation toward ₹840.
Key metrics
Breakout zone: Triangle breakout confirmed on lower timeframe
Support (stop loss): ₹792
Pattern: Triangle breakout on intraday chart
RSI: 64 on the daily chart — supports sustained bullish momentum
Technical analysis:Price action has confirmed a breakout above a triangle formation on the intraday chart, reflecting a transition from consolidation to trend continuation. The RSI reading at 64 supports further upside, and the stock is comfortably trading above short-term moving averages. The breakout suggests increasing momentum and a short-term upside potential toward ₹840.
Risk factors:A close below ₹792 would negate the breakout structure and may lead to a retest of previous support zones. Minor pullbacks are possible if market sentiment weakens, but the setup remains positive above the stop-loss.
Buy at: ₹808.40
Target price: ₹840
Stop loss: ₹792
How the market performed on Tuesday
On 1 July the Nifty 50 closed 24.75 points or 0.10% higher at25,541.80. The BSE Sensex slipped 90.83 points or0.11% to 83,697.29. Nifty Bank remained subdued and closed at 57,459.45, down 146.70 points or0.26%.
Pressure was seen in the FMCG (-0.69%), realty (-0.24%), and energy (-0.24%) sectors, likely due to continued profit booking. On the other hand, PSU banks surged 0.71%, while oil & gas gained 0.49% and the infrastructure index rose 0.45%, helping the market avoid deeper losses.
Top performers included Apollo Hospitals, which rallied 3.51% on strong institutional buying. Bharat Electronics Limited advanced 2.55% and Reliance Industries gained 1.85%, showing strength in large cap and defensive counters.
Nestle India declined 2.24%, followed byAxis Bank (-2.16%) and Shriram Finance (-1.47%), as selling pressure persisted in selective banking and consumption stocks.
Nifty technical analysis: daily & hourly
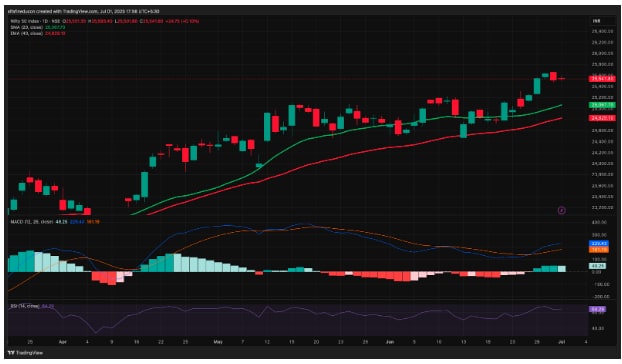
The Nifty continued its gradual upward journey with a modest gain of24.75 points to close at 25,541.80, reflecting persistence in the broader bullish momentum. On the weekly chart, the index continues to hold above previous consolidation zones, indicating potential for further upside, although at a slower pace. On thedaily chart, the momentum from the previous session continued, albeit mildly, keeping the bullish undertone intact. The Bollinger Bands on the daily chart remain slightly expanded, with the price now hovering near the mid-to-upper band, hinting at consolidation with a positive bias.

View Full Image
Technically, Nifty remains above key moving averages, maintaining its upward structure. On the daily timeframe, the index is trading above the 20-day simple moving average (25,067) and40-day exponential moving average (24,829). On the hourly chart, Nifty is currently just below the 20-hour moving average (25,560) and above the 40-hour EMA (25,419), suggesting a narrowing range and a possible inflection point.

View Full Image
Momentum indicators reflect mixed signals. The hourly MACD has cooled to 44, and RSI on the hourly chart has dropped to 57, indicating a slowdown in short-term strength. On the daily chart, however, theRSI remains strong at 64, and MACD continues to build at 229, both of which confirm that the broader trend remains bullish, albeit with reduced near-term velocity.
Option data offers a split view. The total Call OI stands at 18.79 crore while Put OI is at 13.91 crore, leading to a net OI difference of –4.88 crore, indicating a bearish overall positioning. However, a deeper look at thechange in OI shows that Put OI increased by 2.21 crore contracts, while Call OI rose only by 56.34 lakh, resulting in anet change of +1.65 crore in favor of puts, flipping the intraday OI trend tobullish. This reflects a day of fresh defensive put writing and tactical support near current levels.
From a strike positioning standpoint, the highest Call OI remains at 26,000, while the highest Call OI addition is seen at25,600, suggesting resistance in that zone. On the Put side, both the maximum OI and maximum addition are centered at 25,500, solidifying that level as a near-term support.
Volatility remains subdued, with India VIX down 2% at 12.52, reflecting continued investor comfort and low hedging activity. Market breadth was not provided but assumed neutral to slightly positive based on price action and OI dynamics.
In summary, the Nifty’s trend remains structurally positive, but signs of near-term fatigue are emerging. Key support lies around 25,500, followed by deeper support near 25,200. Resistance is expected around 25,600–25,650, with a broader ceiling at 26,000. As long as Nifty sustains above 25,500, intraday dips may continue to attract buying interest, although traders should be alert for range-bound action and reduced momentum ahead of key triggers.
Ankush Bajaj is a Sebi-registered research analyst. His registration number is INH000010441.
Investments in securities are subject to market risks. Read all the related documents carefully before investing.
Registration granted by Sebi and certification from NISM in no way guarantee performance of the intermediary or provide any assurance of returns to investors.
Disclaimer: The views and recommendations given in this article are those of individual analysts. These do not represent the views of Mint. We advise investors to check with certified experts before making any investment decisions.


